System Monitor
Monitoring CPU, memory, network, hard disk, CPU high, memory high, etc. can all be viewed here.
Monitor Overview

| Function | Describe |
|---|---|
| Monitoring Status | Enable or Disable server monitoring |
| Number of days to save | Number of days to save monitoring logs |
| Monitor Log Size | Display monitoring log size |
| Load Average | System load averages for 1, 5, and 15 minutes |
| CPU | CPU Usage |
| Memory | Memory usage |
| Disk I/O | Disk I/O usage |
| Network I/O | Network I/O usage |
Load Average
- View the
system loadof the server in1,5, and15minutes
CPU
- View server
CPU usage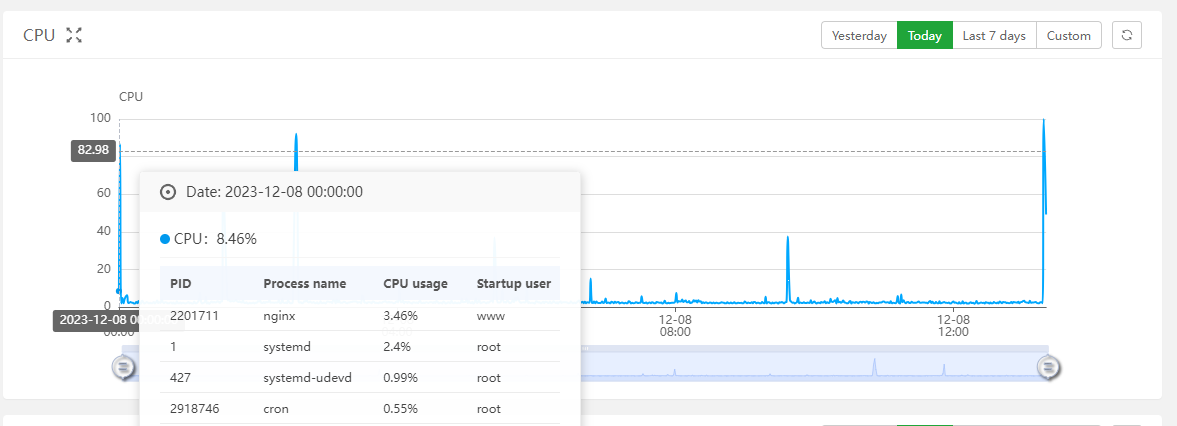
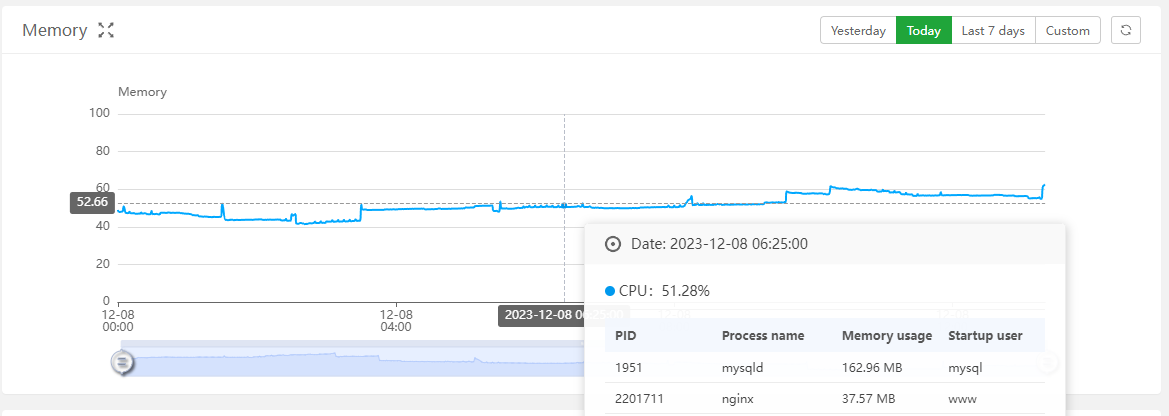
Memory
- View server
memory usage
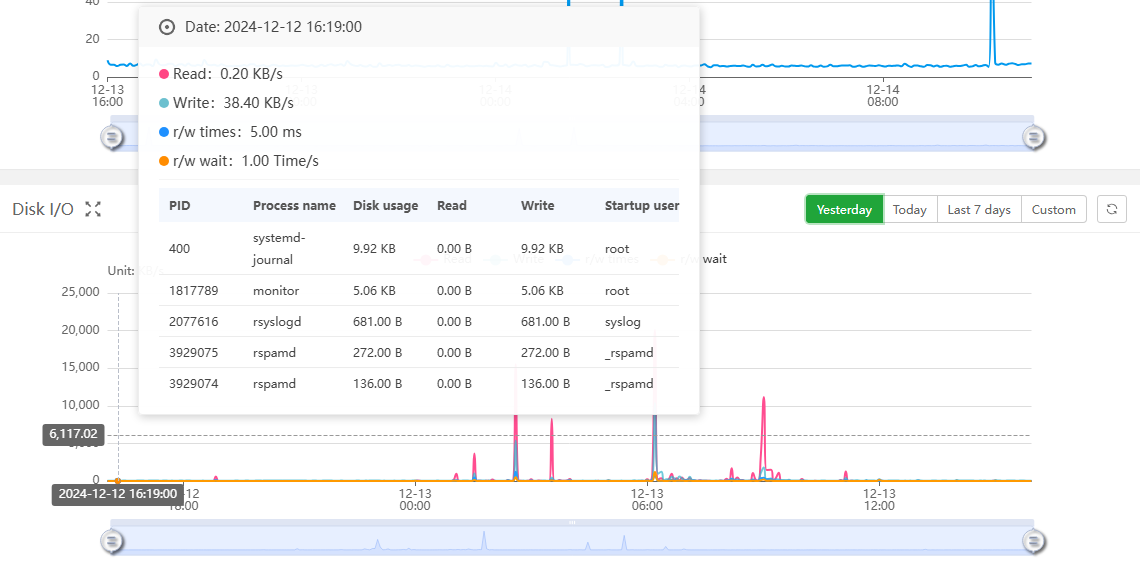
Disk I/O
- View the server
disk read,write, andCPU wait usage
Network I/O
- View the server network,
uploadanddownloadusage of the specified network card
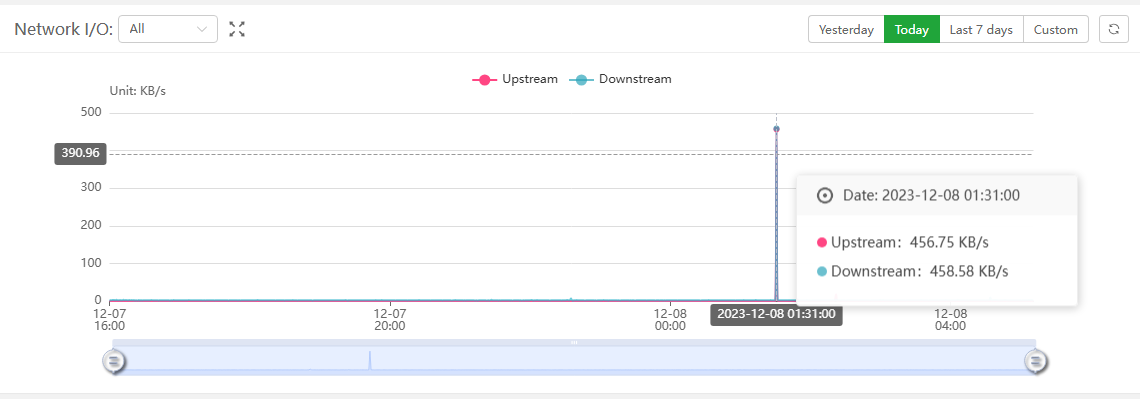
Chart data
Move the cursor over the chart to view the
top 5programprocessesthat use the most resources.
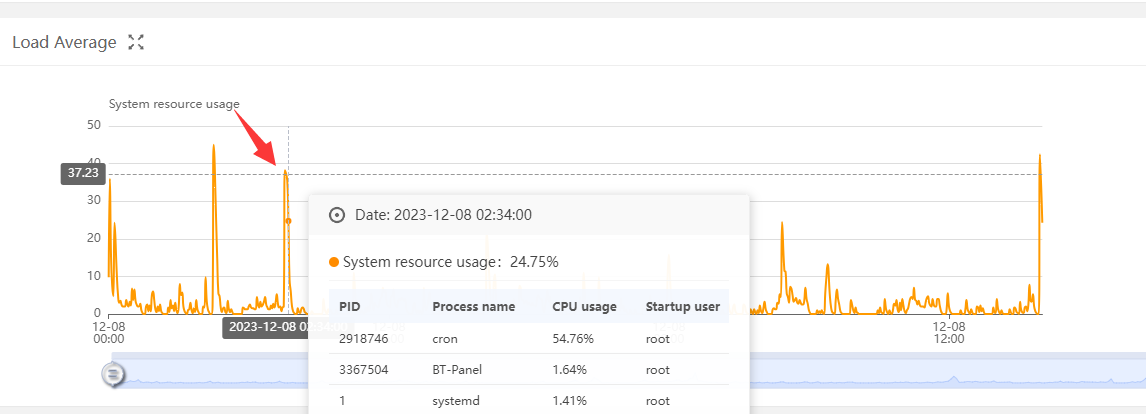
| Function | Describe |
|---|---|
| PID | process ID |
| Process name | process name |
| CPU usage | CPU Usage |
| Startup user | Process startup user |
| Memory usage | Memory usage |
| Read | Disk read speed per second |
| Write | Disk write speed per second |
| r/w times | Read and write times per second |
| r/w wait | Read and write latency per second |
| Upstream | Uploads per second |
| Downstream | Downloads per second |
Clear Logs
- Clear all monitoring data
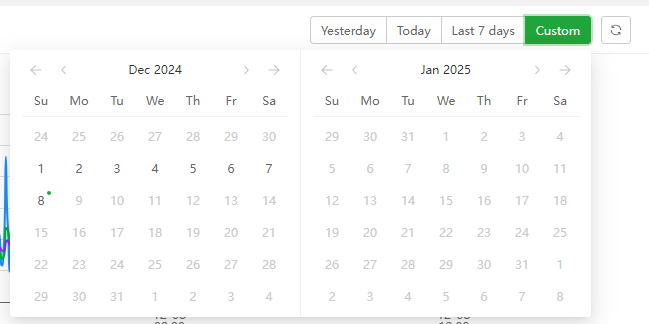
Time Range
- Can choose to view
Yesterday,Today,Last 7 days,Custom
