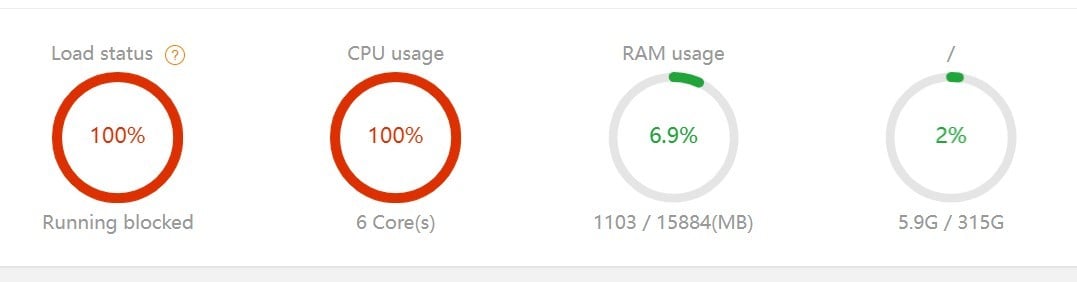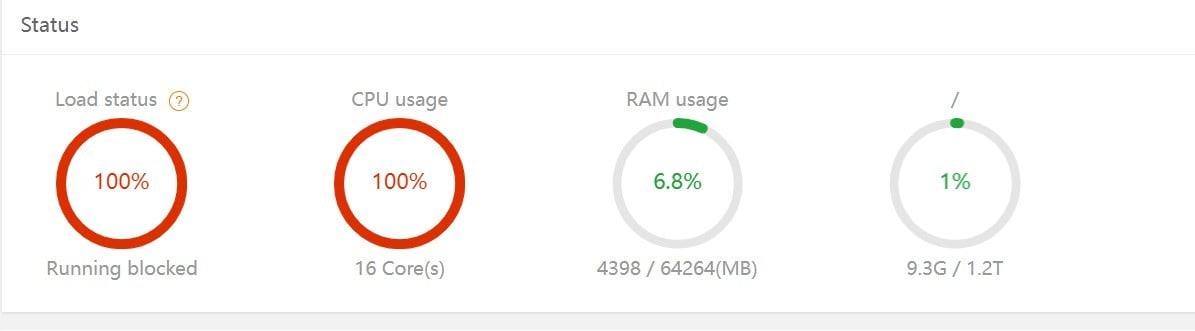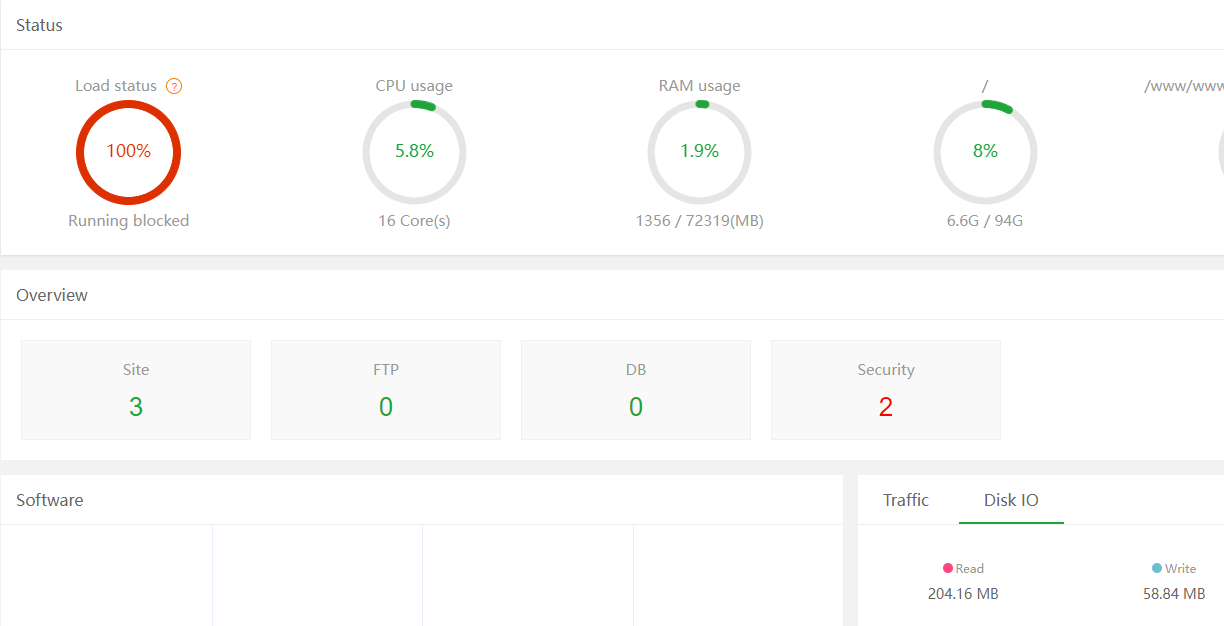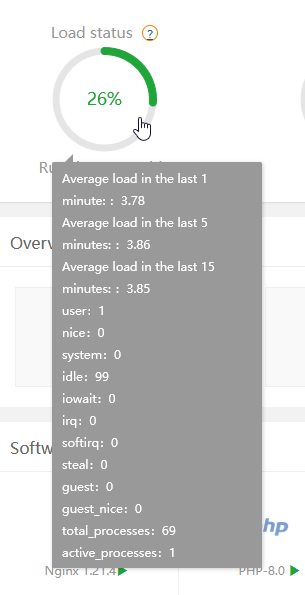
The meaning of percentage in aaPanel's load status chart:
- Below 50%-the server is running at low load
- 50 ~ 90%-The server load is normal, and the user's request can be answered by the server in time
- 90% ~ 100%-indicates that the server resources are exhausted and unable to respond to user requests in a timely manner, you need to check whether the project is operating abnormally as soon as possible, or increase the server configuration
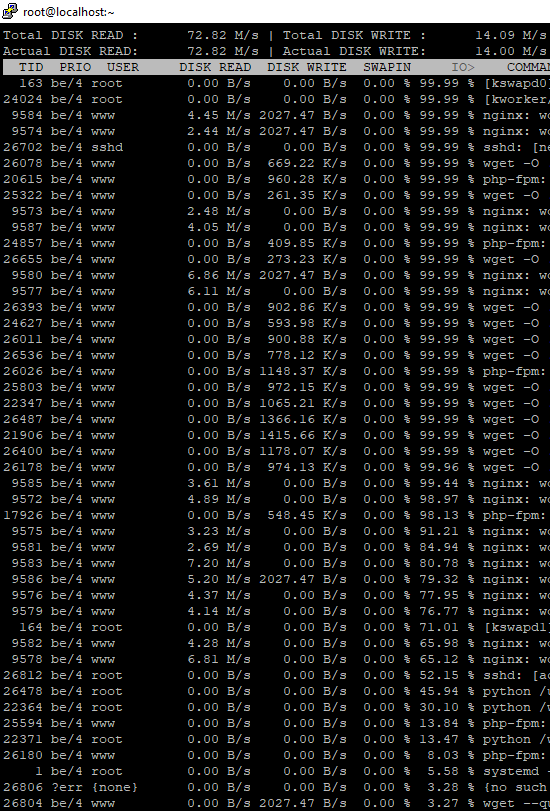
Factors affecting server load:
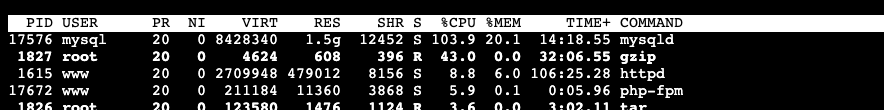
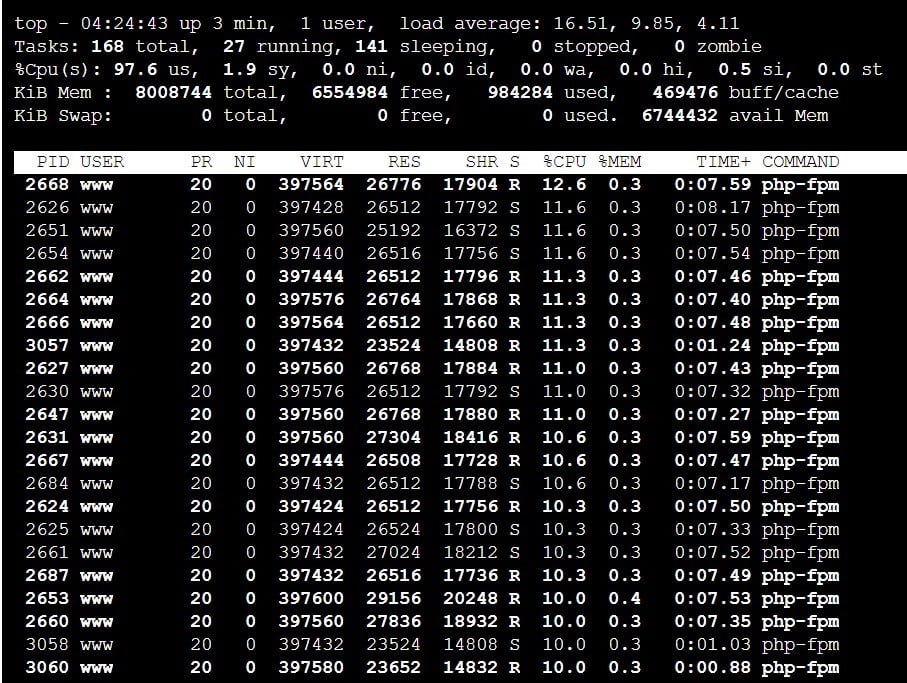
- CPU usage
- Number of threads
- IO usage
- Swap usage rate
- Insufficient resource allocation due to excessive host load